Welcome to the official website of the National Bank of Moldova!
×
Do you have good eyesight and want to turn this tool off?


Welcome to the official website of the National Bank of Moldova!
You can choose one of the most popular reports from the list:

National Bank and the members of its decision-making bodies shall be independent in exercising the tasks conferred upon them by law, and shall neither seek nor take instructions from public authorities or from any other authority.
In order to ensure and maintain price stability over the medium term, the National Bank’s aim will be to keep inflation (measured by Consumer Price Index) at the level of 5.0 percent annually with a possible deviation of ± 1.5 percentage points, considered to be optimal for growth and development of Moldova's economy over the medium-term.

Financial stability is achieved by strengthening the resilience of the financial system, limiting the contagion effect and reducing the accumulation of systemic risks, thus contributing to the sustainability of the financial sector and economic growth.

National Bank shall have the exclusive right to issue on the territory of the Republic of Moldova banknotes and coins as legal tender, as well as commemorative and jubilee banknotes and coins as legal tender and for numismatic purposes.

National Bank is exclusively responsible for the licencing, supervision and regulation of financial institutions activity.
National Bank of Moldova acts as banker and fiscal agent of the State and shall receive from state bodies economic and financial information and documents, which are necessary for carrying out its tasks.
National Bank of Moldova is an autonomous public legal entity and is responsible to the Parliament.

National Bank shall inform the public on the monetary policy strategy on the results of the macroeconomic analysis, the evolution of the financial market and on statistics, including with regard to monetary supply, crediting, balance of payments and the state of the foreign exchange market.

National Bank of Moldova is responsable for the compilation of the balance of payments, international investment position and the statistics of the external debt of the Republic of Moldova.
International accounts for Q I 2017 (preliminary data) – all analytical comments
According to preliminary data, in Q I 2017, the current account of the balance of payments recorded a deficit of 112.77 million (that worsened by 41.5 percent as compared to Q I 2016), the capital account registered a deficit of US$ 11.99 million and the financial account recorded a net inflow of US$ 59.65 million. The international investment position of the Republic of Moldova remained net debit totaling US$ -6,133.37 million at the end of the first quarter of 2017, while the gross external debt of the Republic of Moldova reached US$ 6,688.60 million.
Table 1. Main macroeconomic indicators of the Republic of Moldova
|
|
UM |
2015 |
2016 |
2017 |
|||
|
Q |
|||||||
|
I |
I |
II |
III |
IV |
I |
||
|
Gross domestic product in current prices |
MDL mill. |
24,462 |
27,156 |
31,533 |
39,901 |
36,347 |
29,670 |
|
Gross domestic product in current prices |
US$ mill. |
1,359 |
1,353 |
1,593 |
2,016 |
1,814 |
1,487 |
|
GDP, physical volume indices |
% |
104.8 |
100.8 |
101.9 |
106.5 |
106.7 |
103.1 |
|
Exports of goods, physical volume indices |
% |
106 |
90 |
99 |
121 |
123 |
128 |
|
Exports of goods, unit value indices |
% |
80 |
95 |
98 |
96 |
96 |
99 |
|
Imports of goods, physical volume indices |
% |
101 |
104 |
107 |
112 |
111 |
120 |
|
Imports of goods, unit value indices |
% |
79 |
88 |
93 |
94 |
99 |
100 |
|
Terms of trade |
% |
101.3 |
108.0 |
105.4 |
101.8 |
96.8 |
99.7 |
|
Period average exchange rate |
MDL/USD |
17.9989 |
20.0737 |
19.7957 |
19.7896 |
20.0363 |
19.9556 |
|
Personal remittances / GDP |
% |
23.4 |
21.5 |
22.0 |
17.6 |
19.3 |
21.5 |
|
FDI flows (net incurrence of liabilities) / GDP |
% |
10.9 |
3.0 |
0.0 |
3.3 |
0.9 |
2.8 |
Sourses: NBM, NBS
Table 2. Contribution of the main components to the evolution of the BOP current account(BPM6)
|
|
2015 |
2016 |
2017 |
I 2017 / I 2016 |
|||
|
Q |
Contribution |
||||||
|
I |
I |
II |
III |
IV |
I |
||
|
% to GDP |
p. p. |
||||||
|
Current account |
-10.2 |
-5.9 |
-4.8 |
-4.9 |
-1.2 |
-7.6 |
-1.7 |
|
Trade balance |
-34.8 |
-30.6 |
-30.2 |
-23.5 |
-26.3 |
-31.0 |
-0.4 |
|
Exports of goods and services |
43.9 |
38.9 |
38.9 |
33.6 |
42.6 |
44.8 |
5.9 |
|
Imports of goods and services |
78.7 |
69.5 |
69.0 |
57.1 |
68.8 |
75.8 |
6.3 |
|
Primary income balance |
7.0 |
6.8 |
8.1 |
5.2 |
6.8 |
6.6 |
-0.2 |
|
Primary income inflow, of which: |
13.6 |
11.5 |
12.2 |
10.3 |
10.4 |
12.0 |
0.5 |
|
Compensation of employees |
12.9 |
11.0 |
11.7 |
9.9 |
9.9 |
11.5 |
0.6 |
|
Primary income outflow, of which: |
6.6 |
4.7 |
4.1 |
5.2 |
3.5 |
5.4 |
0.7 |
|
Investment income |
5.3 |
3.4 |
3.0 |
4.4 |
2.5 |
4.2 |
0.7 |
|
Secondary income balance |
17.6 |
17.9 |
17.3 |
13.4 |
18.2 |
16.8 |
-1.1 |
|
Secondary income inflow, of which: |
20.0 |
20.0 |
19.3 |
15.2 |
20.1 |
18.8 |
-1.2 |
|
Personal transfers |
12.6 |
12.3 |
12.2 |
9.5 |
11.0 |
11.6 |
-0.7 |
|
Current international cooperation |
3.6 |
2.9 |
2.7 |
2.0 |
5.0 |
2.4 |
-0.6 |
|
Secondary income outflow |
2.4 |
2.1 |
2.0 |
1.7 |
1.8 |
2.0 |
-0.1 |
|
Capital account |
-0.3 |
-0.8 |
-0.7 |
-0.9 |
-0.4 |
-0.8 |
0.0 |
|
Net borrowing (current and capital account balance) |
-10.5 |
-6.6 |
-5.5 |
-5.8 |
-1.6 |
-8.4 |
-1.8 |
*percentage points
Table 3. Sources of coverage for the net borrowing, net financial flows, % to GDP
|
|
2015 |
2016 |
2017 |
I 2017 / IV 2016 |
|||
|
Q |
Contribution |
||||||
|
I |
I |
II |
III |
IV |
I |
||
|
% to GDP |
p. p. |
||||||
|
Financial account |
-14.8 |
-10.8 |
-4.1 |
-4.3 |
0.4 |
-4.0 |
-4.4 |
|
Direct investment, of which: |
-10.6 |
-2.4 |
0.3 |
-3.3 |
-0.8 |
-2.7 |
-1.9 |
|
Equity other than reinvestment of earnings |
-0.8 |
-1.0 |
-0.4 |
-0.9 |
-1.1 |
-0.6 |
0.5 |
|
Reinvestment of earnings |
-3.2 |
-1.6 |
-1.1 |
-2.9 |
0.2 |
-2.2 |
-2.4 |
|
Debt instruments |
-6.6 |
0.2 |
1.7 |
0.4 |
0.1 |
0.2 |
0.1 |
|
Portfolio investment and financial derivatives |
-0.1 |
0.0 |
0.0 |
0.0 |
0.0 |
-0.1 |
-0.1 |
|
Other investment, of which: |
19.0 |
-7.2 |
-14.5 |
-14.9 |
-4.5 |
-3.8 |
0.7 |
|
Currency and deposits |
19.0 |
-6.2 |
-10.3 |
-9.2 |
3.1 |
-0.7 |
-3.8 |
|
Loans |
1.8 |
1.6 |
-0.3 |
-2.8 |
-5.2 |
-0.3 |
4.9 |
|
Trade credit and advances |
-1.8 |
-2.6 |
-4.0 |
-3.0 |
-2.5 |
-2.9 |
-0.4 |
|
Other accounts receivable / payable |
0.1 |
0.1 |
0.1 |
0.0 |
0.1 |
0.1 |
0.0 |
|
Change in reserve assets |
-23.0 |
-1.1 |
10.2 |
14.0 |
5.7 |
2.5 |
-3.1 |
Note: (-) – net capital inflow, (+) – net capital outflow
*percentage points
Table 4. Main indicators of the international investment position (BPM5)
|
|
31.12. 2013 |
31.12. 2014 |
31.12. 2015 |
31.12. 2016 |
31.03. 2017 |
31.03.2017 / 31.12.2016 (%) |
|
Net IIP, US$ mill. |
-5,346.05 |
-5,598.53 |
-5,587.73 |
-5,979.23 |
-6,133.37 |
102.6 |
|
Stock of foreign assets / stock of foreign liabilities, % |
43.0 |
39.9 |
38.1 |
36.2 |
35.7 |
-0.5 p. p. |
|
Stock of direct investment in domestic economy, US$ mill. |
3,620.97 |
3,613.78 |
3,466.07 |
3,581.43 |
3,664.93 |
102.3 |
|
Share of FDI in the stock of foreign liabilities, % |
38.6 |
38.8 |
38.4 |
38.2 |
38.4 |
0.2 p. p. |
|
Share of loans (without intercompany loans) in the stock of foreign liabilities, % |
34.5 |
32.9 |
32.6 |
32.0 |
31.9 |
-0.5 p. p. |
|
Stock of official reserve assets, US$ mill. |
2,820.63 |
2,156.63 |
1,756.81 |
2,205.93 |
2,256.45 |
102.3 |
|
Stock of reserve assets / Average monthly imports of goods and services (for 12 months), months |
5.6 |
4.4 |
4.8 |
6.0 |
5.9 |
98.2 |
*percentage points
Chart 1. Indices of reserve assets adequacy, at period-end, US$ million
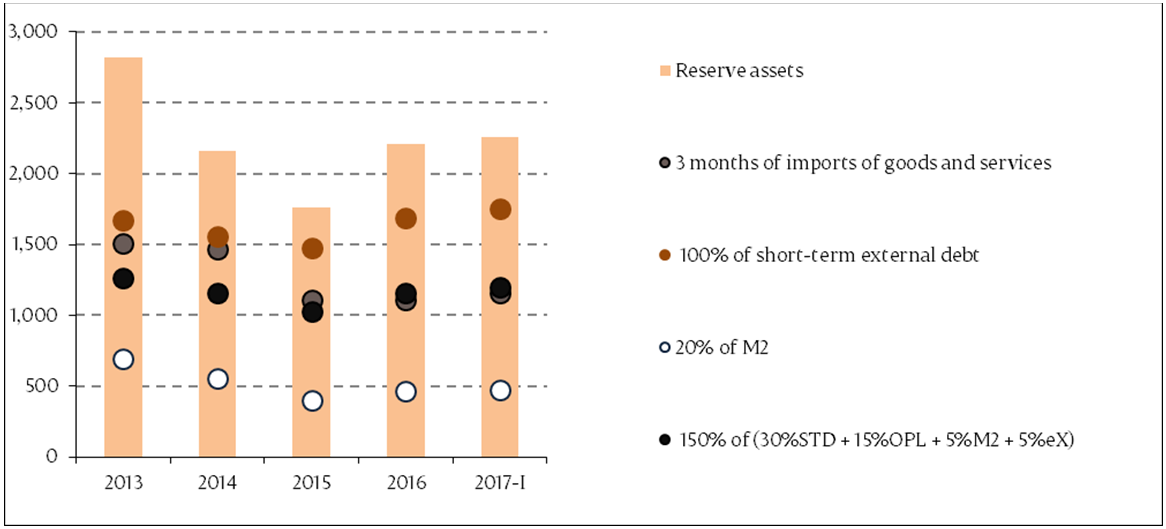
Note: STD – short-term debt, OPL – other portfolio liabilities, M2 – broad money, export-export of goods and services. Criteria based on the IMF recommendations specified in “Assessing Reserve Adequacy - Specific Proposals", April 2015:
Table 5. Main indicators of the external debt (BPM6)
|
|
31.12. 2013 |
31.12. 2014 |
31.12. 2015 |
31.12. 2016 |
31.03. 2017 |
31.03.2017 / 31.12.2016 (%) |
|
Gross external debt, US$ mill. |
6,674.38 |
6,570.26 |
6,381.24 |
6,594.69 |
6,688.60 |
101.4 |
|
Public and publicly guaranteed external debt, US$ mill. |
1,774.92 |
1,731.05 |
1,702.04 |
1,778.90 |
1,826.33 |
102.7 |
|
Long-term external debt, US$ mill. |
5,003.79 |
5,012.32 |
4,909.52 |
4,904.58 |
4,939.57 |
100.7 |
|
Share of public and publicly guaranteed external debt in gross external debt, % |
26.6 |
26.3 |
26.7 |
27.0 |
27.3 |
0.3 p. p. |
|
Share of long-term external debt in gross external debt, % |
75.0 |
76.3 |
76.9 |
74.4 |
73.9 |
-0.5 p. p. |
|
Share of international organizations and foreign governments (creditors) in the external debt in the form of loans and SDR allocations, % |
44.9 |
43.7 |
43.3 |
43.4 |
43.6 |
0.2 p. p. |
|
Official reserve assets / Short-term external debt, % |
168.8 |
138.4 |
119.4 |
130.5 |
129.0 |
-1.5 p. p. |
Note: p. p. – percentage points
Details on international accounts evolution (balance of payments, international investment position and external debt) can be found in the analytical materials published on the official website of NBM:
Time series for balance of payments according to BPM5 are available starting from 1995, according to BPM6 – from 2009, international investment position (BPM5) – from 1998, external debt according to BPM5 – from 2001, according to BPM6 – from 2009:


