Добро пожаловать на официальный сайт Национального банка Молдовы!
×
У вас хорошее зрение, и вы хотите отключить этот инструмент?


Добро пожаловать на официальный сайт Национального банка Молдовы!
Вы можете выбрать один из наиболее востребованных отчетов из списка:

Национальный банк и члены его руководящих органов независимы в осуществлении своих функций, установленных настоящим законом, и не могут обращаться за указаниями и получать таковые от органов публичной власти или какого-либо иного органа.
Стратегия денежной политики НБМ на среднесрочный период предусматривает поддержание количественного объектива инфляции на уровне 5.0% с возможным отклонением ± 1.5 процентных пункта – оптимальный уровень для устойчивого экономического роста и развития Республики Молдова на среднесрочный период.
Национальный банк обладает исключительным правом эмиссии на территории Республики Молдова банкнот и монет в качестве платежного средства.

Национальный банк обладает исключительным правом лицензирования, осуществления надзора и регулирования деятельности финансовых учреждений.
Национальный банк имеет право покупать, продавать и негоциировать иностранную валюту, используя активы, покупать и продавать казначейские обязательства и другие ценные бумаги, выпущенные или гарантированные правительствами иностранных государств и международными финансовыми публичными организациями.

Национальный банк осуществляет надзор за системой платежей в республике и способствует стабильному и эффективному функционированию автоматизированной системы межбанковских платежей.

Национальный банк является самостоятельным публичным юридическим лицом и несет ответственность перед Парламентом.

Национальный банк информирует общественность о динамике годовой инфляции, о стратегии денежной политике, результаты макроэкономического анализа, анализа развития финансового рынка и статистическую информацию, в том числе относительно денежной массы, предоставления кредитов, платежного баланса и положения на валютном рынке.

Национальный банк проводит экономический и денежный анализ, составляет платежный баланс, международную инвестиционную позицию и разрабатывает статистику внешнего долга Республики Молдова.
International accounts for 2015 (preliminary data) – all analytical comments
According to preliminary data, in 2015, the current account of the balance of payments recorded a deficit of US$ 464.24 million (down by 17.7 percent as compared to 2014), the capital account registered a surplus of US$ 22.83 million and the financial account recorded a net inflow of US$ 473.18 million. The international investment position of the Republic of Moldova remained net debit totaling US$ -5,713.43 million at the end of 2015, while the gross external debt of the Republic of Moldova reached US$ 6,338.39 million.
Table 1. Main macroeconomic indicators of the Republic of Moldova
|
UM |
2014 |
Q I 2015 |
Q II 2015 |
Q III 2015 |
Q IV 2015 |
2015 |
|
|
Gross domestic product in current prices |
MDL million |
112,050 |
24,423 |
28,527 |
35,890 |
33,011 |
121,851 |
|
Gross domestic product in current prices |
US$ million |
7,981 |
1,357 |
1,573 |
1,869 |
1,658 |
6,476 |
|
GDP, physical volume indices |
% |
104.6 |
104.8 |
102.5 |
96.3 |
96.7 |
99.5 |
|
Exports of goods, physical volume indices |
% |
102.0 |
106.0 |
107.0 |
96.0 |
97.0 |
|
|
Imports of goods, physical volume indices |
% |
101.0 |
101.0 |
96.0 |
95.0 |
91.0 |
|
|
Period average exchange rate |
MDL/USD |
14.0388 |
17.9989 |
18.1309 |
19.1982 |
19.9112 |
18.8161 |
|
Personal remittances / GDP |
% |
24.1 |
23.1 |
24.1 |
19.5 |
21.2 |
21.8 |
|
FDI flows (net incurrence of liabilities) / GDP |
% |
4.4 |
10.7 |
5.0 |
-0.8 |
3.8 |
4.2 |
Table 2. Contribution of the main components to the evolution of the BOP current account
|
|
2014 |
Q I |
Q II |
Q III |
Q IV |
2015 |
Change in share 2015 / 2014 |
|
|
% to GDP |
p.p. |
|||||
|
Current account |
-7.1 |
-10.5 |
-8.1 |
-6.3 |
-4.6 |
-7.2 |
-0.1 |
|
Trade balance |
-36.7 |
-34.8 |
-31.1 |
-27.8 |
-27.9 |
-30.0 |
6.7 |
|
Exports of goods and services |
36.7 |
44.0 |
40.2 |
31.4 |
40.2 |
38.3 |
1.6 |
|
Imports of goods and services |
73.5 |
78.8 |
71.3 |
59.1 |
68.1 |
68.3 |
-5.1 |
|
Primary income balance |
10.4 |
6.8 |
4.4 |
7.2 |
6.4 |
6.2 |
-4.1 |
|
Primary income inflow, of which: |
14.0 |
13.4 |
14.0 |
11.3 |
12.0 |
12.5 |
-1.5 |
|
Compensation of employees |
13.4 |
12.7 |
13.5 |
10.9 |
11.6 |
12.0 |
-1.3 |
|
Primary income outflow, of which: |
3.7 |
6.6 |
9.6 |
4.1 |
5.6 |
6.3 |
2.7 |
|
Investment income |
2.7 |
5.2 |
8.2 |
3.0 |
4.2 |
5.0 |
2.3 |
|
Secondary income balance |
19.3 |
17.4 |
18.7 |
14.3 |
16.9 |
16.6 |
-2.7 |
|
Secondary income inflow, of which: |
21.1 |
19.8 |
21.0 |
16.3 |
19.0 |
18.8 |
-2.3 |
|
Personal transfers |
12.7 |
12.4 |
12.8 |
10.3 |
11.5 |
11.6 |
-1.1 |
|
Current international cooperation |
4.3 |
3.5 |
3.0 |
2.4 |
3.1 |
3.0 |
-1.4 |
|
Secondary income outflow |
1.8 |
2.3 |
2.3 |
2.0 |
2.1 |
2.2 |
0.3 |
|
Capital account |
1.2 |
-0.3 |
0.6 |
0.5 |
0.5 |
0.4 |
-0.8 |
|
Net borrowing (current and capital account balance) |
-5.9 |
-10.8 |
-7.5 |
-5.8 |
-4.1 |
-6.8 |
-0.9 |
Table 3. Sources of coverage for the net borrowing, net financial flows, % to GDP
|
|
2014 |
Q I |
Q II 2015 |
Q III 2015 |
Q IV 2015 |
2015 |
Change in share 2015 / 2014 |
|
|
% to GDP |
p.p. |
|||||
|
Financial account |
-7.1 |
-14.6 |
-7.9 |
-4.3 |
-4.2 |
-7.3 |
-0.2 |
|
Direct investment, net, of which: |
-3.9 |
-10.5 |
-4.9 |
0.8 |
-3.6 |
-4.1 |
-0.2 |
|
Equity other than reinvestment of earnings |
-1.6 |
-0.9 |
-1.0 |
-0.8 |
-1.0 |
-0.9 |
0.7 |
|
Reinvestment of earnings |
-0.4 |
-3.1 |
-5.2 |
-0.8 |
-1.2 |
-2.5 |
-2.1 |
|
Debt instruments |
-1.9 |
-6.4 |
1.3 |
2.4 |
-1.4 |
-0.7 |
1.2 |
|
Portfolio investment and financial derivatives, net |
-0.2 |
-0.1 |
-0.2 |
-0.1 |
0.1 |
||
|
Other investment, net, of which: |
3.8 |
19.0 |
-3.3 |
-4.2 |
-1.4 |
1.6 |
-2.2 |
|
Currency and deposits, net |
2.3 |
19.0 |
-2.1 |
-0.2 |
-0.8 |
3.2 |
0.9 |
|
Loans, net |
0.1 |
1.7 |
0.9 |
-1.6 |
-1.2 |
-0.2 |
-0.3 |
|
Trade credit and advances , net |
-1.7 |
-1.8 |
-2.2 |
-2.5 |
0.5 |
-1.5 |
0.2 |
|
Other accounts payable / receivable, net |
3.1 |
0.1 |
0.1 |
0.1 |
0.1 |
-3.0 |
|
|
Change in reserve assets, net |
-6.7 |
-23.0 |
0.6 |
-0.9 |
0.8 |
-4.7 |
2.0 |
Note: (-) – net capital inflow, (+) – net capital outflow
Table 4. Main indicators of the international investment position
|
|
UM |
31.12.2014 |
31.03.2015 |
30.06.2015 |
30.09.2015 |
31.12.2015 |
|
Net international investment position |
US$ million |
-5,598.09 |
-5,544.92 |
-5,628.84 |
-5,623.84 |
-5,713.43 |
|
Stock of foreign assets / stock of foreign liabilities |
% |
39.9 |
38.6 |
38.2 |
37.9 |
36.9 |
|
Stock of foreign direct investment in domestic economy |
US$ million |
3,613.78 |
3,489.23 |
3,549.58 |
3,474.91 |
3,538.59 |
|
Share of foreign investment in the stock of foreign liabilities |
% |
38.8 |
38.7 |
39.0 |
38.4 |
39.1 |
|
Share of loans (without intercompany loans) in the stock of foreign liabilities |
% |
32.9 |
32.3 |
32.1 |
32.7 |
32.6 |
|
Stock of reserve assets |
US$ million |
2,156.63 |
1,752.26 |
1,787.80 |
1,769.37 |
1,756.81 |
|
Stock of reserve assets / Average monthly imports of goods and services |
months |
4.4 |
3.7 |
4.1 |
4.3 |
4.8 |
|
Official reserve assets / Short-term external debt |
% |
89.2 |
72.6 |
74.0 |
73.7 |
74.8 |
Chart 1. Indices of reserve assets adequacy, end of 2009-2015, US$ million
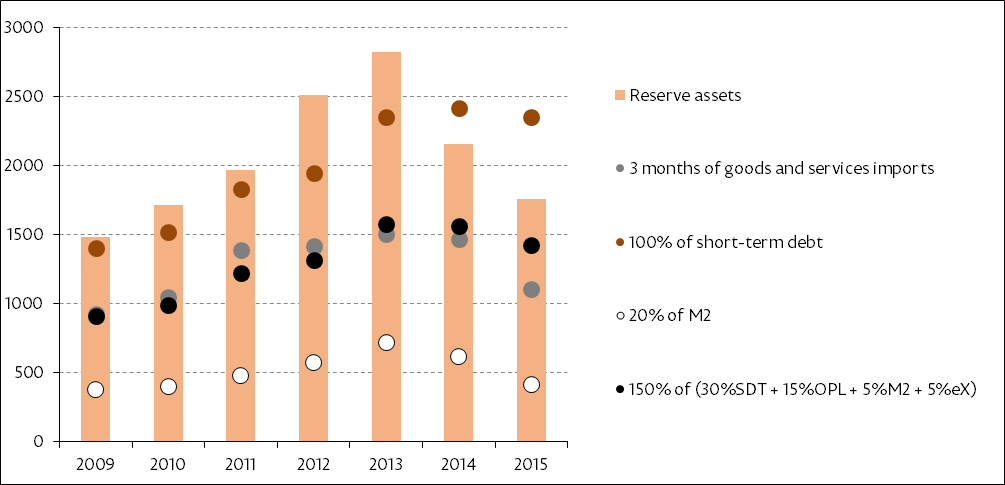
Note: The criteria are based on the IMF recommendations specified in "Assessing Reserve Adequacy - Specific Proposals", April 2015: http://www.imf.org/external/np/pp/eng/2014/121914.pdf
Table 5. Main indicators of the external debt
|
|
UM |
31.12.2014 |
31.03.2015 |
30.06.2015 |
30.09.2015 |
31.12.2015 |
|
Gross external debt |
US$ million |
6,570.26 |
6,393.53 |
6,414.45 |
6,421.10 |
6,338.39 |
|
Public and publicly guaranteed external debt |
US$ million |
1,731.05 |
1,651.93 |
1,685.18 |
1,712.77 |
1,702.04 |
|
Long-term external debt |
US$ million |
4,152.39 |
3,981.33 |
3,997.26 |
4,018.71 |
3,988.96 |
|
Share of public and publicly guaranteed external debt in gross external debt |
% |
26.3 |
25.8 |
26.3 |
26.7 |
26.9 |
|
Share of long-term external debt in gross external debt |
% |
63.2 |
62.3 |
62.3 |
62.6 |
62.9 |
|
Share of international organizations and foreign governments (creditors) in the external debt in the form of loans and SDR allocations |
% |
43.7 |
42.9 |
43.3 |
43.5 |
43.1 |
Details on international accounts evolution (balance of payments, international investment position and external debt) can be found in the analytical materials published on the official website of NBM:
Balance of payments for 2015 (preliminary data)
International investment position at the end of 2015 (preliminary data)
External debt at the end of 2015 (preliminary data)
Balance of payments data calculated according to BPM6 can be downloaded here:
Time series on balance of payments (starting from 1995), international investment position (from 1998), and external debt (from 2000) can be found on the official website of NBM:


