Добро пожаловать на официальный сайт Национального банка Молдовы!
×
У вас хорошее зрение, и вы хотите отключить этот инструмент?


Добро пожаловать на официальный сайт Национального банка Молдовы!
Вы можете выбрать один из наиболее востребованных отчетов из списка:

Национальный банк и члены его руководящих органов независимы в осуществлении своих функций, установленных настоящим законом, и не могут обращаться за указаниями и получать таковые от органов публичной власти или какого-либо иного органа.
Стратегия денежной политики НБМ на среднесрочный период предусматривает поддержание количественного объектива инфляции на уровне 5.0% с возможным отклонением ± 1.5 процентных пункта – оптимальный уровень для устойчивого экономического роста и развития Республики Молдова на среднесрочный период.
Национальный банк обладает исключительным правом эмиссии на территории Республики Молдова банкнот и монет в качестве платежного средства.

Национальный банк обладает исключительным правом лицензирования, осуществления надзора и регулирования деятельности финансовых учреждений.
Национальный банк имеет право покупать, продавать и негоциировать иностранную валюту, используя активы, покупать и продавать казначейские обязательства и другие ценные бумаги, выпущенные или гарантированные правительствами иностранных государств и международными финансовыми публичными организациями.

Национальный банк осуществляет надзор за системой платежей в республике и способствует стабильному и эффективному функционированию автоматизированной системы межбанковских платежей.

Национальный банк является самостоятельным публичным юридическим лицом и несет ответственность перед Парламентом.

Национальный банк информирует общественность о динамике годовой инфляции, о стратегии денежной политике, результаты макроэкономического анализа, анализа развития финансового рынка и статистическую информацию, в том числе относительно денежной массы, предоставления кредитов, платежного баланса и положения на валютном рынке.

Национальный банк проводит экономический и денежный анализ, составляет платежный баланс, международную инвестиционную позицию и разрабатывает статистику внешнего долга Республики Молдова.
International accounts of the Republic of Moldova, Quarter III 2017 (preliminary data)
In January-September 2017, the current account of the balance of payments recorded a deficit of US$ 532.56 million (of which US$ -207.62 in Q III 2017), which worsened by 87.7 percent as compared to January- September 2016. The capital account registered a deficit of US$ 17.88 million (of which US$ -5.46 million in Q III 2017) and the financial account recorded a net capital inflow of US$ 301.96 million (of which US$ 129.44 million in Q III 2017). The international investment position of the Republic of Moldova represented US$ -4,201.41 million at the end of Q III 2017, while the gross external debt of the Republic of Moldova reached US$ 6,742.97 million.
Table 1. Main macroeconomic indicators of the Republic of Moldova
|
|
2015 |
2016 |
2017 |
2016 |
2017 |
||
|
III |
III |
I |
II |
III |
I-III |
I-III |
|
|
Gross domestic product in current prices, MDl mil. |
35,995 |
39,901 |
29,670 |
34,251 |
45,523 |
98,281 |
109,444 |
|
Gross domestic product in current prices, US$ mill. |
1,875 |
2,016 |
1,487 |
1,826 |
2,540 |
4,942 |
5,800 |
|
GDP, physical volume indices, % |
96.4 |
106.5 |
103.1 |
102.5 |
105.4 |
103.3 |
103.8 |
|
Exports of goods, physical volume indices, % |
96.0 |
120.9 |
127.6 |
105.0 |
109.8 |
|
|
|
Exports of goods, unit value indices, % |
84.0 |
95.9 |
99.4 |
97.4 |
107.7 |
|
|
|
Imports of goods, physical volume indices, % |
95.0 |
111.5 |
120.1 |
113.3 |
113.4 |
|
|
|
Imports of goods, unit value indices, % |
78.0 |
94.2 |
99.7 |
100.8 |
107.9 |
|
|
|
Terms of trade, % |
107.7 |
101.8 |
99.7 |
96.6 |
99.8 |
|
|
|
Period average exchange rate, MDL/USD |
19.1982 |
19.7896 |
19.9556 |
18.7525 |
17.9208 |
19.8860 |
18.8689 |
|
Personal remittances / GDP, % |
20.1 |
18.1 |
22.6 |
21.5 |
16.4 |
20.6 |
19.7 |
|
FDI flows (net incurrence of liabilities) / GDP, % |
-1.2 |
3.4 |
2.8 |
1.9 |
2.8 |
2.2 |
2.5 |
Sourses: NBM, NBS
Table 2. Contribution of the main components to the evolution of the BOP current account(BPM6)
|
|
2015 |
2016 |
2017 |
2016 |
2017 |
I-III 2017 / I-III 2016 |
||
|
|
III |
III |
I |
II |
III |
I-III |
I-III |
Contribution |
|
% to GDP |
p. p. |
|||||||
|
Current account |
-6.7 |
-5.5 |
-8.6 |
-10.8 |
-8.2 |
-5.7 |
-9.2 |
-3.4 |
|
Trade balance |
-28.3 |
-23.9 |
-31.3 |
-33.7 |
-24.1 |
-28.1 |
-29.2 |
-1.1 |
|
Exports of goods and services |
31.3 |
33.5 |
44.7 |
36.2 |
31.8 |
36.8 |
36.8 |
-0.1 |
|
Imports of goods and services |
59.7 |
57.4 |
76.1 |
69.9 |
55.9 |
64.9 |
66.0 |
1.1 |
|
Primary income balance |
7.5 |
5.1 |
6.9 |
7.8 |
4.9 |
6.4 |
6.3 |
-0.1 |
|
Primary income inflow, of which: |
11.3 |
10.3 |
12.3 |
12.2 |
9.3 |
11.3 |
11.1 |
-0.2 |
|
Compensation of employees |
10.9 |
9.9 |
11.9 |
11.7 |
8.9 |
10.8 |
10.6 |
-0.2 |
|
Primary income outflow, of which: |
3.8 |
5.3 |
5.4 |
4.5 |
4.4 |
4.9 |
4.7 |
-0.1 |
|
Investment income |
2.7 |
4.4 |
4.2 |
3.3 |
3.6 |
3.8 |
3.7 |
-0.1 |
|
Secondary income balance |
14.1 |
13.4 |
15.9 |
15.2 |
11.0 |
15.9 |
13.7 |
-2.2 |
|
Secondary income inflow, of which: |
16.2 |
15.0 |
17.9 |
17.1 |
12.4 |
17.7 |
15.4 |
-2.4 |
|
Personal transfers |
10.3 |
9.5 |
11.9 |
10.9 |
8.4 |
11.2 |
10.2 |
-1.0 |
|
Current international cooperation |
2.4 |
2.0 |
2.0 |
2.2 |
1.4 |
2.5 |
1.8 |
-0.7 |
|
Secondary income outflow |
2.1 |
1.6 |
2.0 |
1.9 |
1.4 |
1.8 |
1.7 |
-0.1 |
|
Capital account |
1.1 |
-0.5 |
-0.4 |
-0.4 |
-0.2 |
-0.4 |
-0.3 |
0.1 |
|
Net borrowing (current and capital account balance) |
-5.6 |
-6.0 |
-9.0 |
-11.1 |
-8.4 |
-6.2 |
-9.5 |
-3.3 |
*percentage points
Table 3. Sources of coverage for the net borrowing, net financial flows, % to GDP
|
|
2015 |
2016 |
2017 |
|
|
2016 |
2017 |
I-III 2017 / I-III 2016 |
|
|
III |
III |
I |
II |
III |
I-III |
I-III |
Contribution |
|
% to GDP |
p. p. |
|||||||
|
Financial account |
-7.0 |
-3.0 |
-3.1 |
-6.9 |
-5.1 |
-5.0 |
-5.2 |
-0.2 |
|
Direct investment, of which: |
1.2 |
-3.3 |
-2.7 |
-1.5 |
-2.7 |
-1.9 |
-2.4 |
-0.5 |
|
Equity other than reinvestment of earnings |
-0.2 |
-0.6 |
-0.3 |
0.0 |
-0.4 |
-0.4 |
-0.3 |
0.2 |
|
Reinvestment of earnings |
-0.8 |
-2.9 |
-2.2 |
-0.9 |
-1.7 |
-2.0 |
-1.6 |
0.4 |
|
Debt instruments |
2.1 |
0.1 |
-0.2 |
-0.6 |
-0.6 |
0.6 |
-0.5 |
-1.1 |
|
Portfolio investment and financial derivatives |
0.0 |
0.0 |
-0.1 |
0.0 |
0.0 |
0.0 |
0.0 |
0.0 |
|
Other investment, of which: |
-7.3 |
-13.7 |
-2.8 |
-11.1 |
-11.0 |
-11.8 |
-9.1 |
2.7 |
|
Currency and deposits |
-5.0 |
-8.4 |
-0.9 |
-4.5 |
-7.3 |
-8.0 |
-4.8 |
3.1 |
|
Loans |
-1.8 |
-2.7 |
-0.4 |
-2.3 |
-0.8 |
-0.6 |
-1.2 |
-0.6 |
|
Trade credit and advances |
-0.6 |
-1.7 |
-1.6 |
-3.9 |
-3.3 |
-2.5 |
-3.1 |
-0.6 |
|
Other accounts receivable / payable |
0.1 |
-0.9 |
0.1 |
-0.4 |
0.4 |
-0.7 |
0.1 |
0.8 |
|
Change in reserve assets |
-0.9 |
14.0 |
2.5 |
5.7 |
8.7 |
8.7 |
6.2 |
-2.4 |
Note: (-) – net capital inflow, (+) – net capital outflow
*percentage points
Table 4. Main indicators of the international investment position (BPM5)
|
|
31.12.2015 |
31.12.2016 |
31.03.2017 |
30.06.2017 |
30.09.2017 |
30.09.2017 / 31.12.2016 (%) |
|
Net IIP, US$ mill. |
-3,479.02 |
-3,550.57 |
-3,645.80 |
-3,998.40 |
-4,201.41 |
118.3 |
|
Stock of foreign assets / stock of foreign liabilities, % |
53.2 |
53.5 |
53.3 |
51.8 |
51.3 |
-2.2 p.p. |
|
Stock of direct investment, liabilities, US$ mill. |
2,980.08 |
3,037.51 |
3,128.09 |
3,399.19 |
3,574.34 |
117.7 |
|
Share of FDI in the stock of foreign liabilities, % |
40.1 |
39.7 |
40.0 |
41.0 |
41.4 |
1.7 p.p. |
|
Share of loans (without intercompany loans) in the stock of foreign liabilities, % |
41.2 |
41.1 |
40.7 |
39.7 |
38.9 |
-2.1 p.p. |
|
Stock of official reserve assets, US$ mill. |
1,756.81 |
2,205.93 |
2,256.45 |
2,388.74 |
2,629.41 |
119.2 |
|
Stock of reserve assets / Average monthly actual imports of goods and services (for 12 months), months |
4.7 |
5.9 |
5.8 |
5.9 |
6.2 |
104.7 |
*percentage points
Chart 1. Indices of reserve assets adequacy, at period-end, US$ million
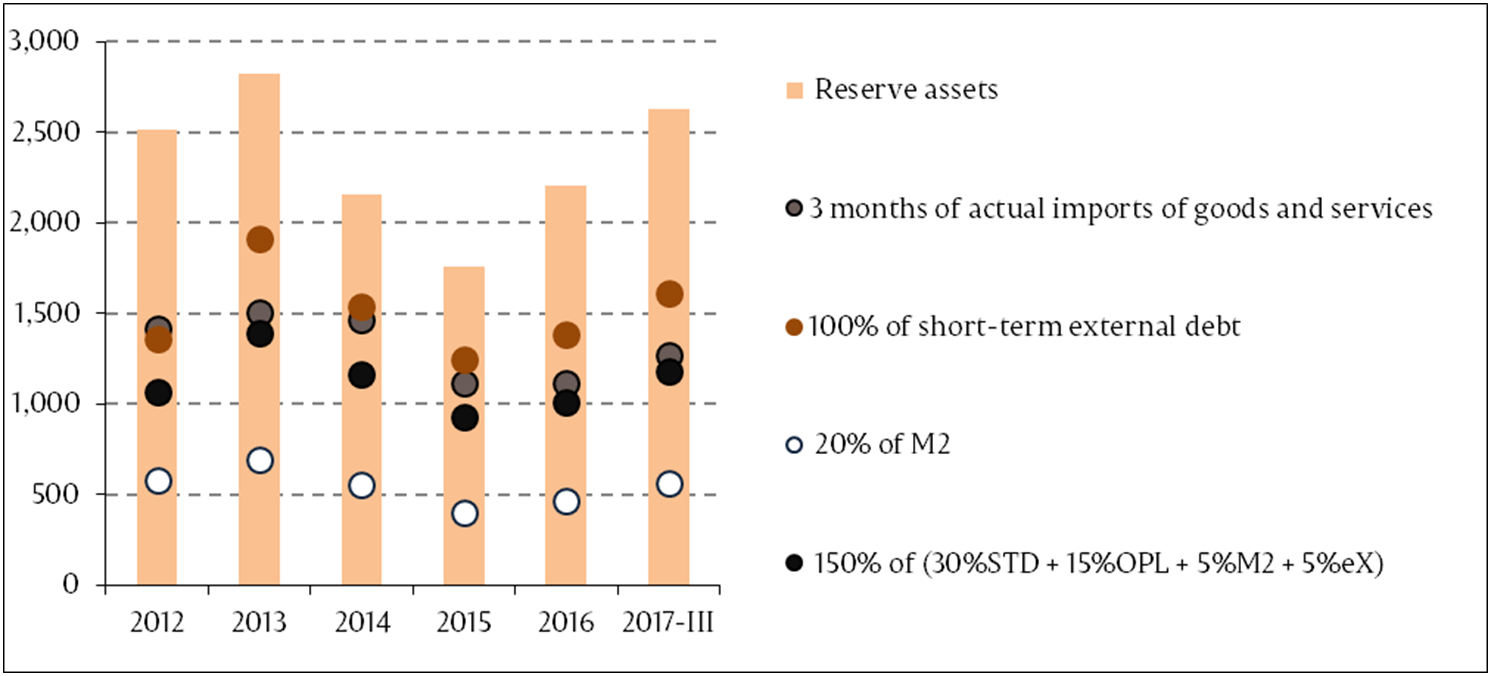
Note: STD – short-term debt, OPL – other portfolio liabilities, M2 – broad money, export-export of goods and services. Criteria based on the IMF recommendations specified in “Assessing Reserve Adequacy - Specific Proposals", April 2015:
Table 5. Main indicators of the external debt (BPM6)
|
|
31.12.2015 |
31.12.2016 |
31.03.2017 |
30.06.2017 |
30.09.2017 |
30.09.2017 / 31.12.2016 (%) |
|
Gross external debt, US$ mill. |
6,104.21 |
6,235.23 |
6,323.63 |
6,557.58 |
6,742.97 |
108.1 |
|
Public and publicly guaranteed external debt, US$ mill. |
1,702.11 |
1,779.36 |
1,827.08 |
1,909.65 |
1,960.32 |
110.2 |
|
Long-term external debt, US$ mill. |
4,854.62 |
4,846.64 |
4,895.93 |
5,043.79 |
5,128.05 |
105.8 |
|
Share of public and publicly guaranteed external debt in gross external debt, % |
27.9 |
28.5 |
28.9 |
29.1 |
29.1 |
0.5 p.p. |
|
Share of long-term external debt in gross external debt, % |
79.5 |
77.7 |
77.4 |
76.9 |
76.1 |
-1.7 p.p. |
|
Share of international organizations and foreign governments (creditors) in the external debt in the form of loans and SDR allocations, % |
44.2 |
44.7 |
44.9 |
45.4 |
45.6 |
0.9 p.p. |
|
Official reserve assets / Short-term external debt, % |
140.6 |
158.9 |
158.0 |
157.8 |
162.8 |
4.0 p.p. |
Note: p. p. – percentage points
Details on international accounts evolution (balance of payments, international investment position and external debt) can be found in the analytical materials published on the official website of NBM:
Time series are available starting from:
Balance of payments (BPM6)
International investment position (BPM6)
External debt (BPM6)
Interactive database:


