Bine ați venit pe pagină oficială a Băncii Naționale a Moldovei!
×
Ai vederea bună și dorești să închizi acest instrument?


Bine ați venit pe pagină oficială a Băncii Naționale a Moldovei!
Cele mai populare rapoarte statistice:

Banca Naţională şi membrii organelor de conducere ale acesteia sunt independenţi în exercitarea atribuţiilor stabilite de lege şi nu pot solicita şi nici accepta instrucţiuni de la autorităţile publice sau de la orice altă autoritate.

Banca Naţională informează publicul despre evoluția inflației anuale, strategia de politică monetară,rezultatele analizei macroeconomice, evoluţiei pieţei financiare şi informaţia statistică, inclusiv privind masa monetară, acordarea creditelor, balanţa de plăţi şi situaţia pieţei valutare.
Pentru asigurarea şi menţinerea stabilităţii preţurilor pe termen mediu, Banca Naţională a Moldovei menţine inflaţia (măsurată prin indicele preţurilor de consum) la nivelul de 5.0 la sută anual cu o posibilă abatere de ± 1.5 puncte procentuale, fiind considerat nivelul optim pentru creşterea şi dezvoltarea economică a Republicii Moldova pe termen mediu.
Stabilitatea financiară se realizează prin consolidarea rezilienței sistemului financiar, limitarea efectului de contagiune și diminuarea acumulării de riscuri sistemice, contribuind, astfel, la sustenabilitatea sectorului financiar și creșterea economică.

Banca Naţională a Moldovei, are dreptul exclusiv de a emite pe teritoriul Republicii Moldova bancnote şi monede metalice ca mijloc de plată. BNM pune în circulaţie bancnote şi monede metalice, prin intermediul sistemului bancar.

Banca Naţională este unica instituţie care efectuează licenţierea, supravegherea şi reglementarea activităţii instituţiilor financiare.

Banca Națională supraveghează sistemul de plăţi în Republica Moldova şi promovează funcţionarea stabilă şi eficientă a sistemului automatizat de plăţi interbancare.

Banca Naţională este o persoană juridică publică autonomă şi este responsabilă faţă de Parlament.

BNM publică statistici privind masa monetară, sectorul bancar, balanța de plăți, situația pieței valutare, etc. pentru a asigura transparența în procesul de elaborare și adoptare a deciziilor BNM, a asigura continuitatea în comunicare și predictibilitatea BNM pe piață, pentru sporirea credibilității BNM în calitate de bancă centrală dar și pe piața financiar-bancară din Republica Moldova.
Inflation Report no.1, February 2014
The macroeconomic situation analysis involves the assessment of a set of statistical indicators reflecting the market fluctuations to the utmost extent. Thus, over time, in addition to socio-economic statistics presented by the national statistics agencies, there were developed adjacent statistics calculated by private companies, which have proven their relevance by capturing the economic phenomena effectively and relatively fast. This category includes the PMI indexes (Purchasing Managers' Indexes), the usefulness of their analysis to capture the evolution of external macroeconomic environment is undeniable.
PMI indexes have been developed in many countries by private companies to provide the stock exchange agents and decision makers in business and economic analysts with an accurate and timely set of supporting data for a better perception of economic conditions. PMI indexes are based on monthly surveys carried out in some selected companies, which offer an advance indication of what is really happening in the private sector economy by capturing variables, such as the result of economic activity, new orders, stock levels, employment and prices in the manufacturing, constructions, retail trade and services sectors. Data are collected by similar methods in most countries so that international comparisons can be made. The key features of PMI indexes are: they provide indicators based on results as opposed to opinion or confidence-based indicators; they are produced much faster than the official data series; they are published monthly; they cover almost all economic activities of the private sector in many countries (including in all major sectors of services); they are not revised after publication; they are produced using similar methodology in almost all countries, allowing international comparisons.
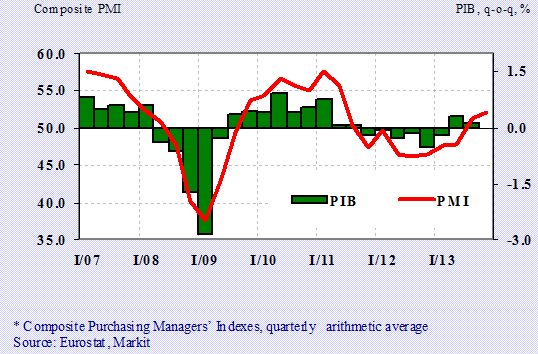
The set point for the PMI is 50. Thus, a PMI of more than 50 represents an expansion compared to the previous month. A reading under 50 represents a contraction, while a reading at 50 indicates no change. Among the most famous companies that calculate the PMI indexes are ISM (USA), Markit, HSBC, JP Morgan etc. In most cases, PMI indexes are calculated for the industrial sector (Manufacturing PMI), services sector (Services IMP) and composite (Composite PMI). In addition to PMI indexes calculated for each country, aggregated PMI indexes are also calculated, for example, for the emerging economies (HSBC Emerging Markets Index PMI) and globally (JP Morgan Global PMI) etc.
In macroeconomic analysis, PMI indexes for the industrial sector tend to be correlated with the indexes of industrial production. Most of the times, in macroeconomic analysis, the composite PMI indexes are used as a preliminary reflection of the GDP quarterly growth and the fact that they are published every month is an undeniable advantage for economic policy decisions, while the GDP is published quarterly and after a relatively long period of time as of the end of the reporting period (Chart no.1).